Today, we released a new version of Search Console Helper: 1.1.3. It marks our first attempt at integrating Google Analytics into the application. Take a look and tell us what you think!
You will find Google Analytics data in two places in Search Console Helper 1.1.3.:
Premium page
A new Get Analytics Data button has been added to the data set menu. Clicking it will connect to your Google Analytics account and fetch data from the first-listed view for your given property.

Once the data is fetched, you will see 11 new columns added to the data set:
- PageTitle – the page’s title.
- Users – the total number of users for the requested time period.
- Sessions – the total number of sessions.
- Bounces – the total number of single page (or single interaction hit) sessions for the property.
- AvgSessionDuration – the average duration (in seconds) of users’ sessions.
- BounceRate – the percentage of single-page session (i.e., session in which the person left the property from the first page).
- Exits – the number of exits from the property.
- ExitRate – the percentage of exits from the property that occurred out of the total pageviews.
- AvgTimeOnPage – the average time users spent viewing this page or a set of pages.
- UniquePageViews – the number of sessions during which the specified page was viewed at least once. A unique pageview is counted for each page URL + page title combination.
- PageViews – the total number of pageviews for the property.

Tip: right now, we are able to fetch corresponding Google Analytics data only at the page level. Therefore, we suggest you hide the Query column by un-checking the Query box, in order to avoid viewing skewed data.
Analytics page
We have added a completely new page to the menu, the Analytics page. Here, you can compile your own set of data from Google Analytics.
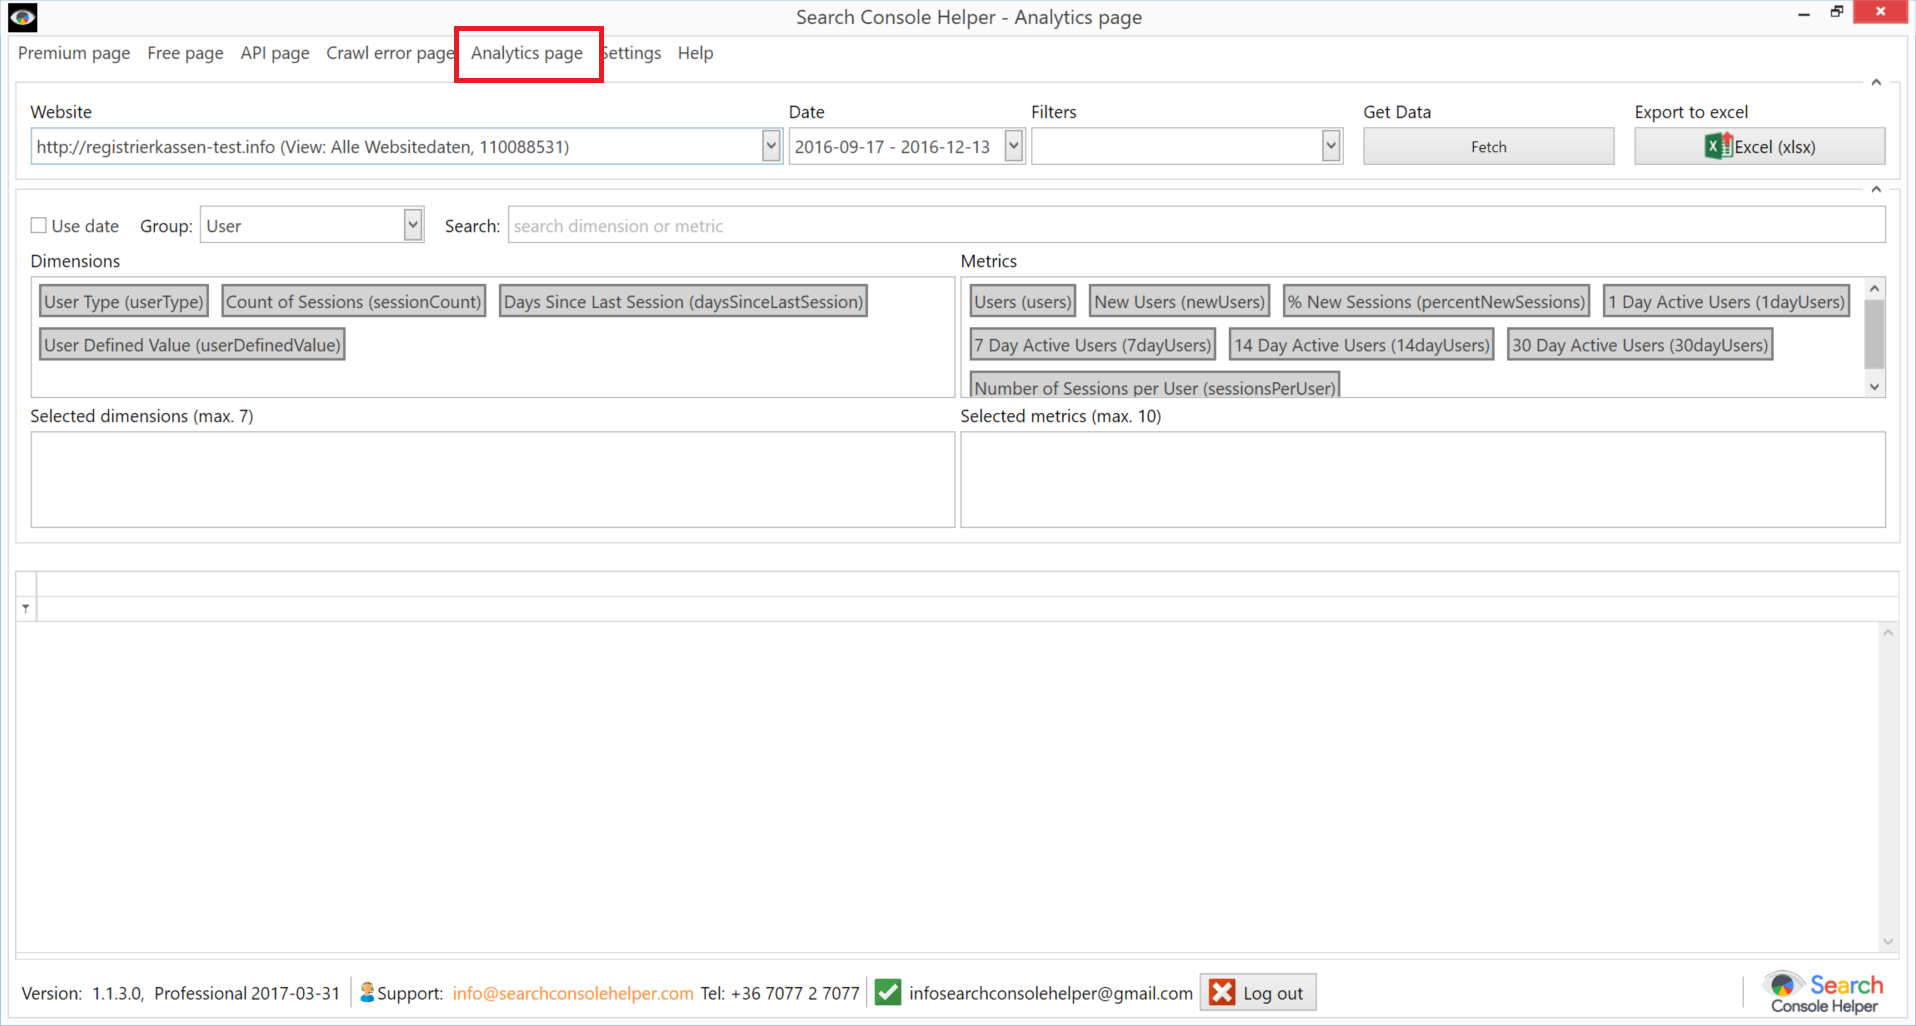
Step 1: start by selecting the property and the respective view. Then, select the date period.

Step 2: Next, you select a combination dimensions and metrics. Here’s a complete set of Google Analytics dimensions and metrics. You will find them by either selecting the respective Group or by using the search box. There is a limit of how many you can select (imposed by Google): maximum of 7 dimensions and 10 metrics.

To select a dimension or metric, double click on it or drag it to the box below. To re-order the dimensions or metrics, simply drag and move the item to its new position.
Step 3: Once done, click Fetch.

Step 4 (optional): You can save your selection of dimensions and metrics by clicking the Filters dropbox and selecting Add...

Help us improve
As mentioned earlier, this is our first attempt at putting together “apples and oranges” so that the result makes sense and actually creates value for you.
However, we realize that the current state of affairs is far from ideal and can be dramatically improved.
Therefore, please share with us any feedback you may have. Specifically, we want to know what dimensions and metrics you would like to see presented together with the Google Search Console data set.
Also, we would like to know if there are any combinations of Google Analytics dimensions and metrics that you are using often and would like to see as pre-configured.
Of course, we welcome any other input you may have.