Data Fetching
Work with any number of websites
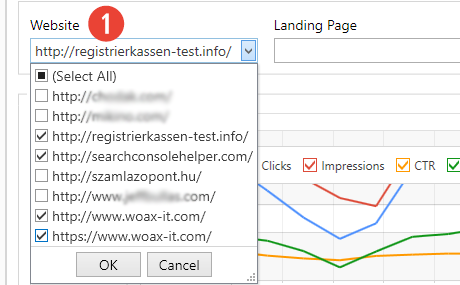
You can simultaneously work on any number of websites or properties. The only limitation is the number of properties you have in your Google Search Console account. Select either all, multiple or a single property from the drop-down list. Selecting all or multiple properties will allow you to work with aggregated data for the selected properties. This is especially useful if you use both http and https versions of your website for instance, several subdomains, or host important pages on external domains.
Work with any number of pages
Just like with websites or properties, you can work with any number of pages. Simply select from the drop-down list All, multiple pages or just one. Search Console Helper will fetch the data matching your selection.
Search for any page you want
Finding a single page among hundreds or thousands of pages is a breeze in Search Console Helper. Simply, enter part of the URL into the Landing page box and hit Enter. Our comfy search function will immediately return the list of pages containing your text. For example, if you are looking for all pages that contain the keyword “registrierkassen” in the URL, type “registrierkassen” and hit Enter. You will get a list of only those pages that contain the indicated keyword.
all SearchTypes – Web, Image, Video
You can fetch data for 3 different search types: Web, Images and Video. This data gives you a better understanding of where your search traffic originated. Web indicates that the search was performed in the classic Google Search. Accordingly, Images and Video indicate that the search requests originated in the Google Search for Images and Video. Search Console Helper of course allows you to fetch data for all search types or just for some. Your choice.
Data for all types of devices
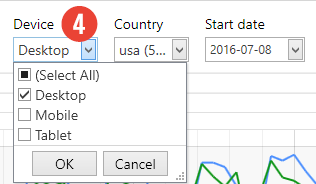
You can fetch separate data for searches from 3 types of devices: Desktop, Mobile and Tablet. This information allows you to see what type of device your visitors are using. It also allows you to compare results from different devices. Naturally, you are able to fetch data for all devices, just one or any combination of the three.
Data from 200 countries
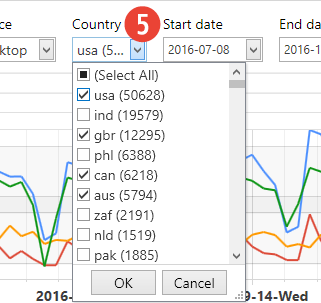
If your target audience is located in multiple countries, you need to be able to see how each country or language is performing. With data fetched for 200 different countries and your ability to view information for all, some or only one country, geographical analysis of your website’s performance is a breeze.
Move the start date
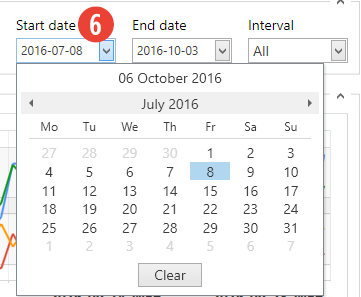
Changing the start date for the desired period is as easy as clicking a button and navigating to the desired date. A familiar calendar view, complete with names of the week days, makes this task super-easy.
Move the end date
Extending or shortening the period for which you wish to fetch the data is just as easy as moving the start date. Simply click on the box and navigate to the desired date in a beautiful calendar view.
Select a pre-defined time period
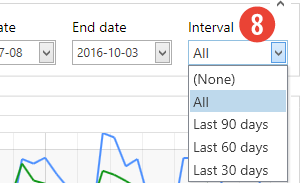
The last date feature allows you to select a pre-defined time period with 1 click of a mouse. Currently available periods are: Last 30, 60 and 90 days, and All time, which automatically fetches data for all days. So, whether you forgot, when you started using Search Console Helper or you need a quick way to fetch all data, this option is your best friend.
Data Visualization
Prominent key indicators
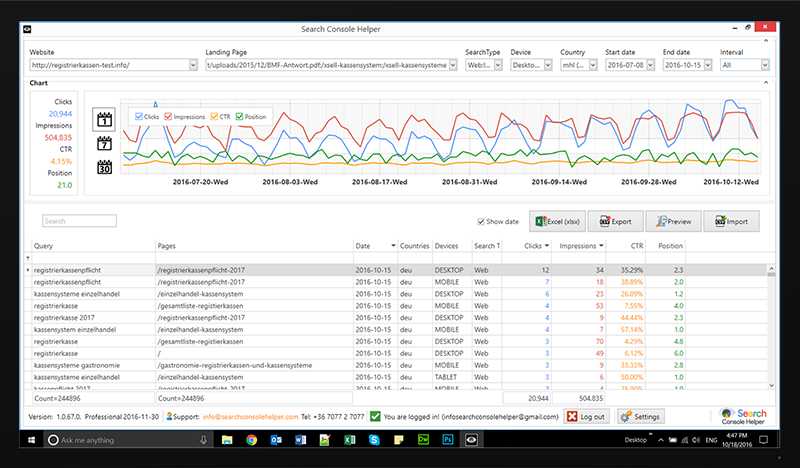
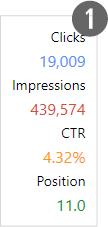
Regardless of what data you are viewing, these four key indicators are always prominently visible. Clicks tells you how many people have clicked on your search result in Google. Impressions tells you how many people have seen your result in Google Search. CTR stands for click-through rate and tells you about the percentage of user that have seen your result in Google Search and clicked on it. Lastly, Position indicates an average ranking position in Google Search. This data comes straight from Google, so there is no other or more accurate source of information.
View data by day, week or month
You can switch between the daily, weekly or monthly view simply by clicking a button. This feature allows you to spot trends that you might have missed otherwise. Here is an example: By just looking at your daily fluctuations, you might not be able to tell right away if your results are getting better over time or not. Switching to a weekly or monthly view reveals this particular information right away. Daily view, on the other hand, allows you to spot short-term anomalies, which might get lost in the full aggregated data.
View key indicators on a chart
The chart displays the position of all key indicators over the chosen period of time. You can easily turn individual indicators on or off by checking and unchecking their box. This allows you to either view the performance of individual indicators or to compare the performance of sets of indicators over time.
View detailed data for a specific day
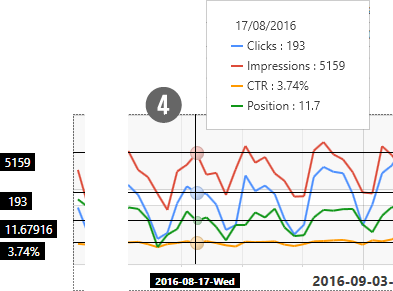
Whenever you hover over the chart, you will see detailed information for that given day. As you move your cursor to the next day, the information automatically changes to reflect your new position in the chart. This is very useful for a quick day-on-day comparison or to follow trends.
Data Set
View all data in a table
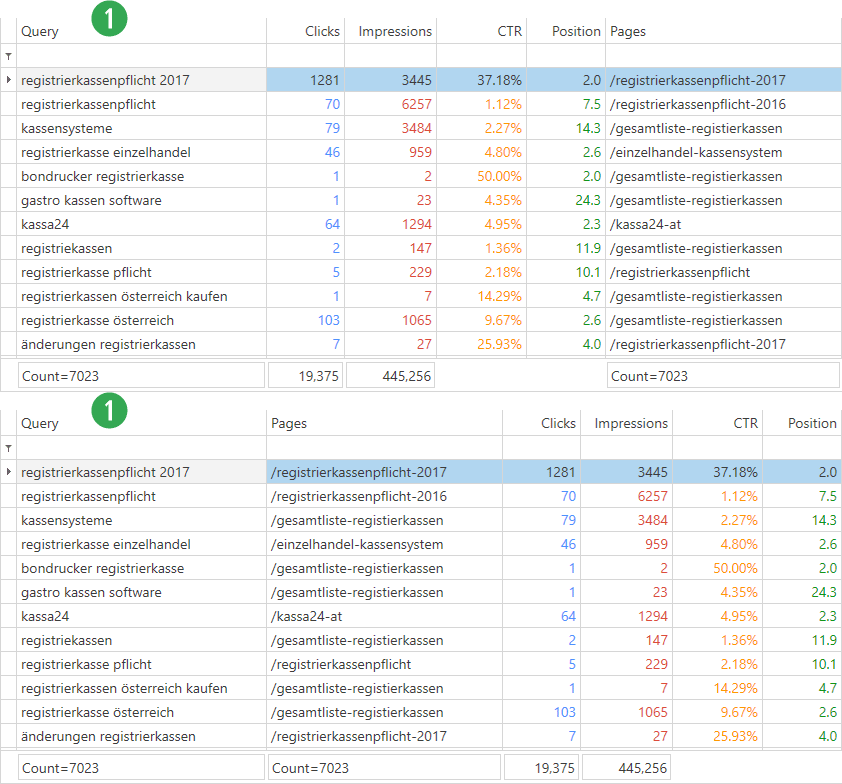
You can view every data set in an easy-to-follow tabulated form. Depending on the level of data that you have fetched, you will see the following columns: Query, Pages, Clicks, Impressions, CTR, Position, Search Type, Devices and Countries.
Re-order columns the way you want
You are completely in control of the columns order in your data set. If you wish to move any of the columns, simply drag it to the required position. This allows you to view the information exactly the way you want it.
Search for any string of text
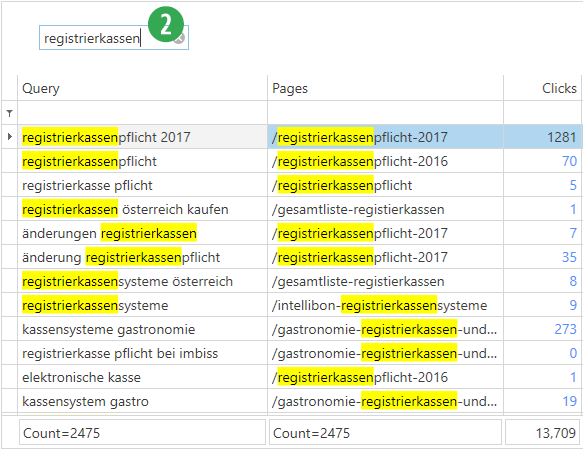
The search box on top of the data set offers you an easy way to find either a search query or a landing page, based on a string of text. Simply type in any term in the search box and you see results immediately in the data set, with updated data AND the string text highlighted. This is very helpful in case you are looking for a particular keyword or page or if you are getting ready to filter the data set based on additional criteria.
Add date dimension to data
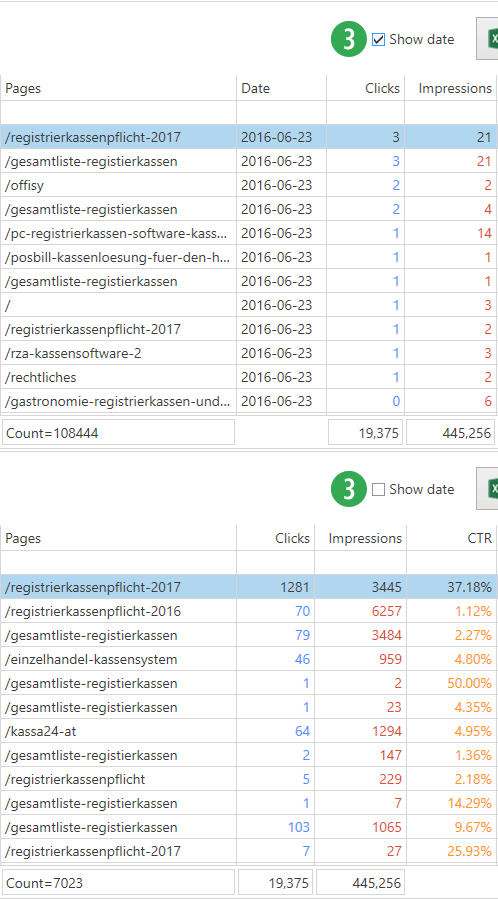
This useful function will add a date column to the data by simply checking the corresponding box. By doing so, the selection will break down each record by date and adds a separate row for each day and record. This granular view gives you another view dimension and allows you to easily spot any past anomalies or possible future trends in your data.
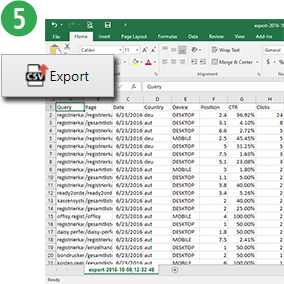
Export to Excel
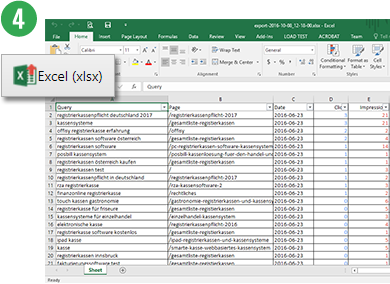
Do you need to show some data to your “SEO guy”? Simply export your current view into an Excel spreadsheet and email it to her/him.
Export as CSV
No Microsoft Excel? No problem. Simply export your data into a CSV (“comma-separated values”) file, which can be imported into all popular programs that work with tabulated data. Basically, all spreadsheets and database management systems support this type of file.
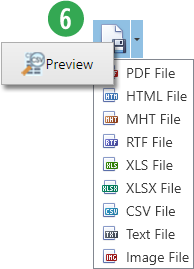
Export to 7 additional file formats
If you need more than an Excel or CVS file export, the Preview panel allows you to save your data set in 7 additional file formats, including: HTML, MHT, RTF, XLS, Text and Image. This enables you to share data with others in any format you need.
Print your data
The Preview function also allows you to send your data to the printer and get a physical paper printout just in case you want to take a second look or make written notes about your thoughts.
Import data in CSV format
You can of course also export data from Serch Console Helper. All you need is a CSV file. This way you can pass on data to any other party (or a sub-set of it), without giving access to your Google Search Console. One will simply import your data into his own Search Console Helper and can work with it without the need to connect to your Google Search Console account. This means full functionality with zero security and data-leak risk.
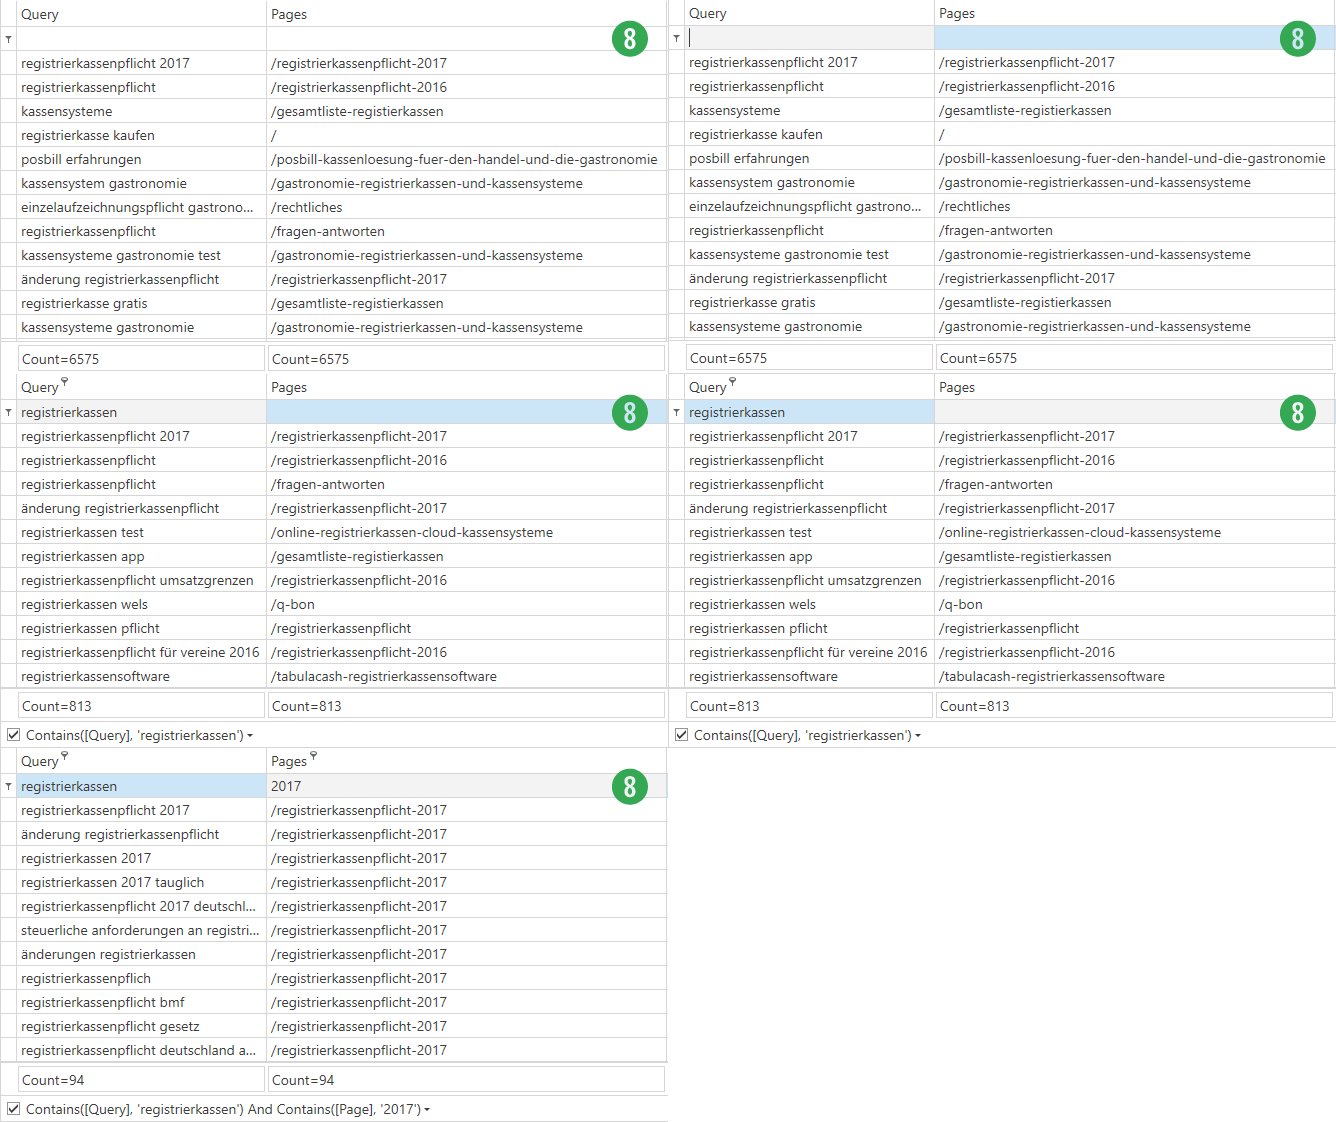
Filter data in multiple columns
You can type any term into the top row of any column and the data will be automatically filtered according to what was indicated. For example, when you type “registrierkassen” into the Query column, you will see only keywords that contain the word “registrierkassen”. When you further type “2017” into the Pages column, the previously filtered results will be further narrowed down to those pages that contain “2017” in their URL. This is a super-fast way to drill down the data and focus only on specified terms.
Filter pages by entire keywords
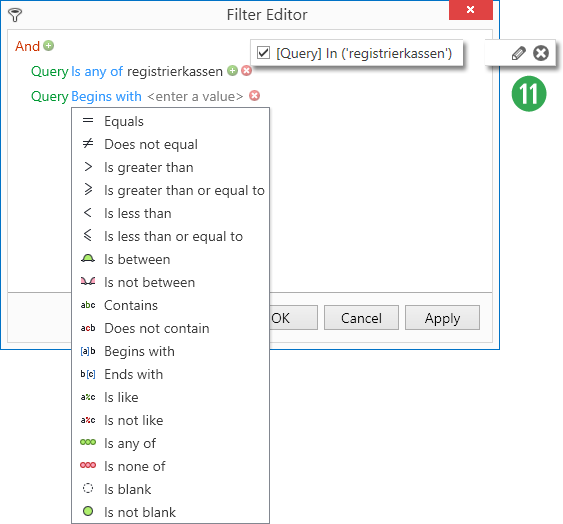
By right-clicking inside the data set, a menu will be displayed that allows you to filter the data by a complete keyword and/or URL. This is not only another way to filter data but it is also the best way to view data related to any Query or Page.
Quickly view rankings in Google
If you want to understand where your keyword is currently ranking in the actual Google results, simply right-click the keyword and then select Search keyword in Google. You can choose between regular (personalized to you) search or anonymous search.
View data in any order
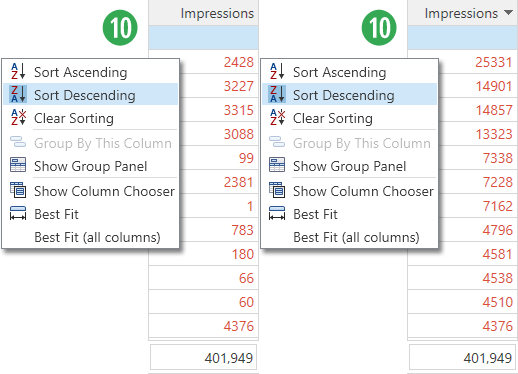
You can sort the data in either ascending (A-Z, smallest to largest) or descending (Z-A, largest to smallest) order by either right-clicking the column header and selecting the desired order or by left-clicking it. The data will be immediately sorted.
View all pages per keyword
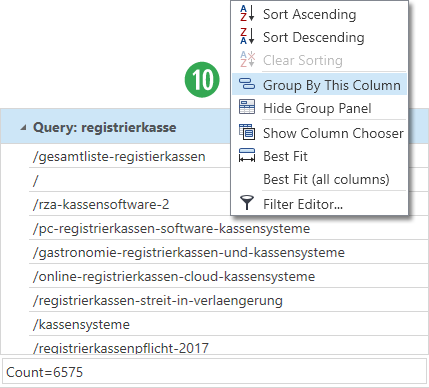
You can see all pages that are ranking for any given keyword by right-clicking on the Query column header and selecting Group By This Column. Your data will be immediately re-grouped under individual keywords. You can then view the list of pages by clicking the keyword. This function is especially useful when you are analyzing traffic cannibalization.
View all keywords per page
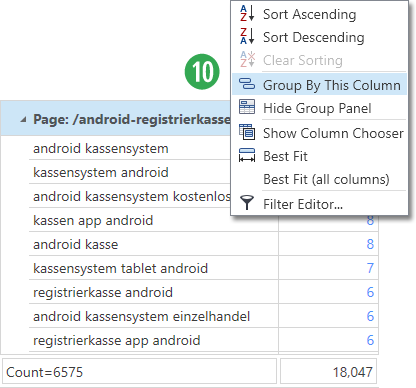
You can see all keywords for any given page coming up in Google Search results by right-clicking on the Pages column header and selecting Group By This Column. Your data will be immediately re-grouped on a per-page basis. You can then view the keyword list by clicking the page’s name. This function is especially useful when you are optimizing pages and looking for new traffic opportunities.
View any columns
You can choose to view any column you like, depending on your needs. Simply right-click on the column header, select Show Column Chooser and drag-and-drop any number of columns anywhere in the data set.
Other Features
Switch between Google Accounts
The Login/Logout button allows you to disconnect from your current Google Search Console account and log in with another account — without loosing any data! This is very useful for agencies and businesses working with multiple Google Accounts.
Customize data aggregation
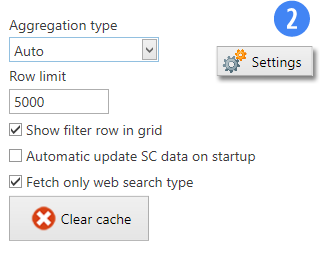
If you wish to change the number of rows to be fetched from Google pre-request or if data should be fetched automatically upon starting Search Console Helper, you are free to do so in the first panel of the Settings area.
Work in your own language
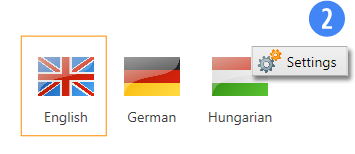
Search Console Helper is currently available in three language versions: English, German and Hungarian.
Change the font size
Do you have troubles reading small fonts on a screen? Or perhaps you wish to fit more data on your screen? You can change the default font size in the Themes area of the Settings section and customize it based on your needs.
Select different look & feel
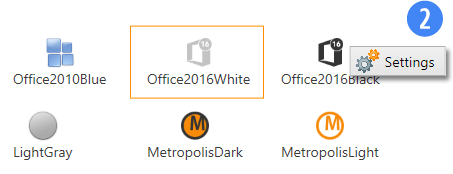
Pick any of the six different themes and instantly modify the look and feel of Search Console Helper. You can do so from within the Themes area of the Settings section.
Update and backup
Program updates normally happen automatically, when you launch Search Console Helper. You can also update your version or backup your data manually in the Settings section.
Use your own Google API key
Search Console Helper comes with an already pre-installed (our own) Google Client ID. This means that you can start fetching data from Google right away, without the need to do any additional tasks. However, this also means that you are sharing the same Google API with other Search Console Helper users, who use the default settings. Entering your own Google Client ID allows you to fetch data independently. This is especially useful, when you have a very large website and need to perform a lot of data fetching.
Go Professional!
Of course you can benefit most from Search Console Helper by upgrading to the Professional version – check out all the advantages here.

